Module Heatmap Summary Report
Introducing the Module Heatmap Summary
A visual representation of testing activity and execution results. Quickly identify high-risk areas, execution patterns, pass/fail distribution, and modules that require immediate attention, enabling teams to prioritize testing efforts and improve overall product quality.
How to Add the Report
- Log in to your QA Touch account.
- Open the desired Project.
- Navigate to Reports from the menu.
- Click Add Reports.
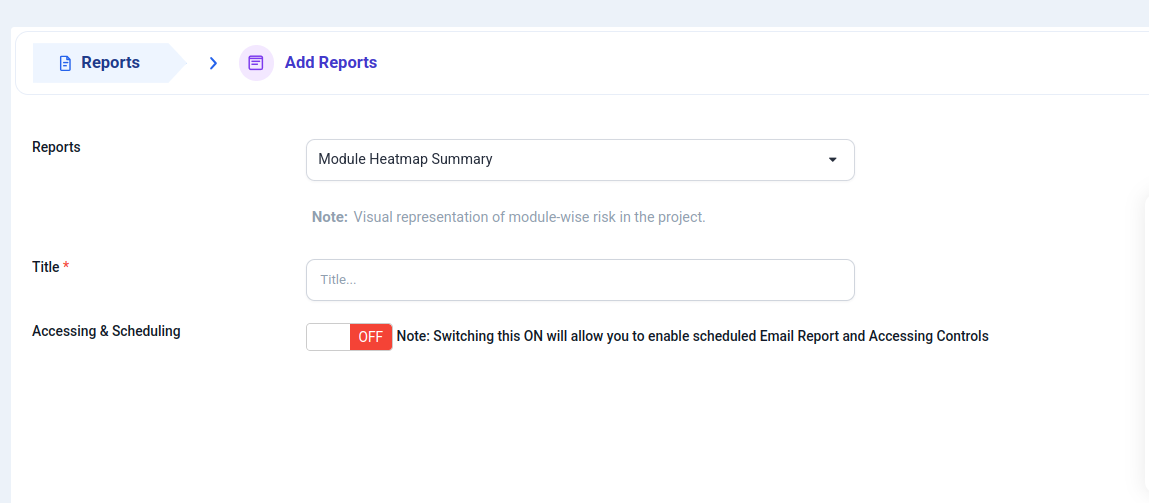
- From the Reports dropdown, select Module Heatmap Summary.
- Enter a Title for your report (required).
- (Optional) Toggle Accessing & Scheduling to ON if you want to enable a scheduled email report and set access controls for specific users.
- Save to generate the report.
Understanding the Report View
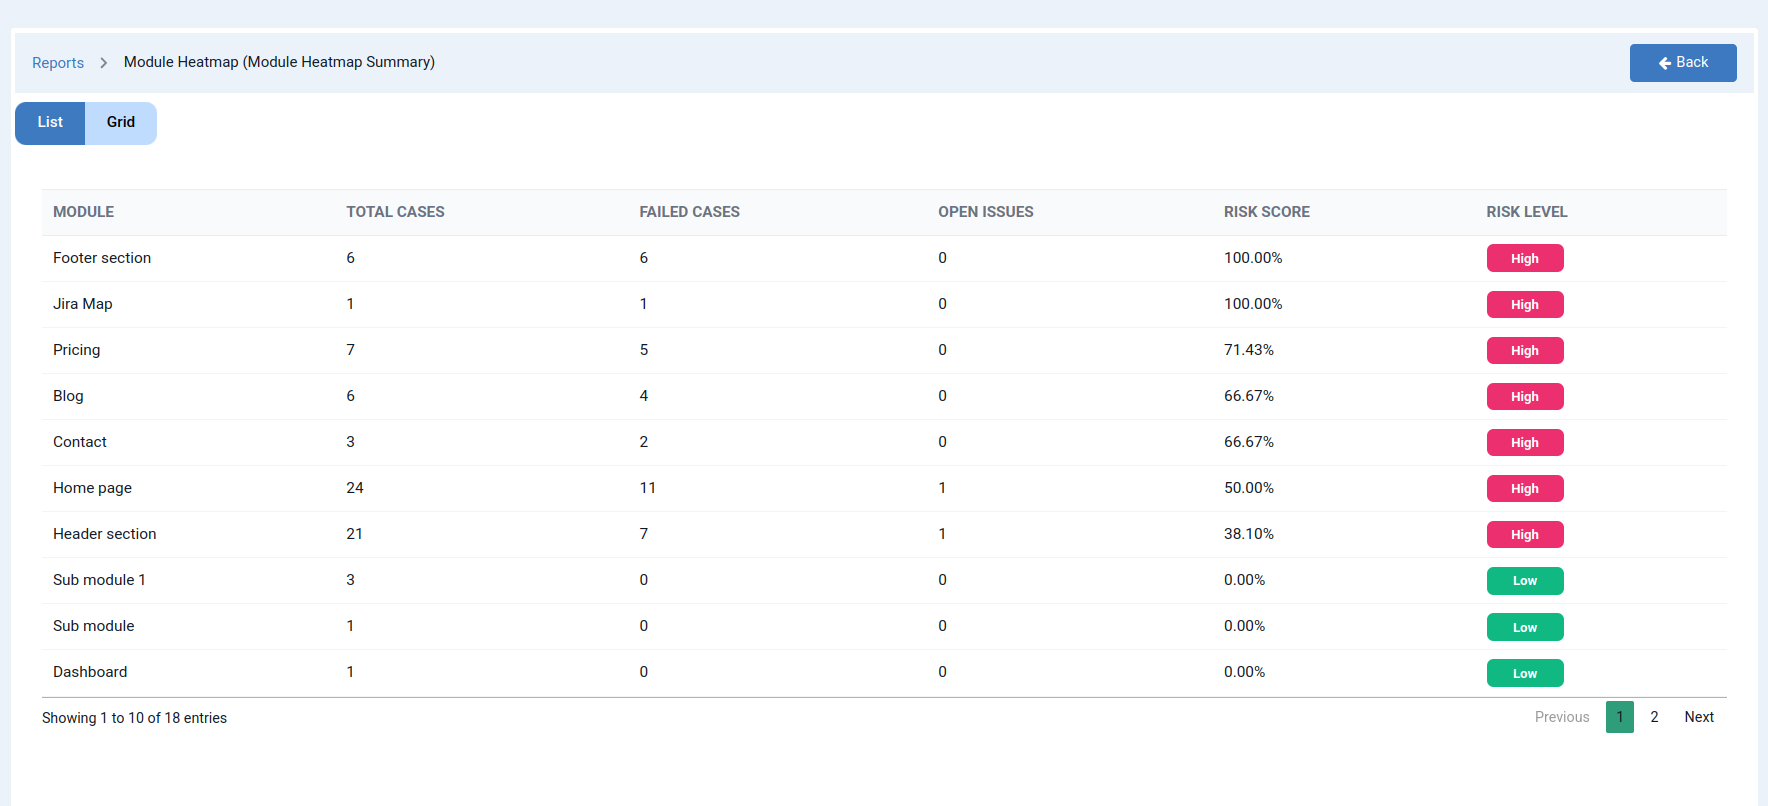
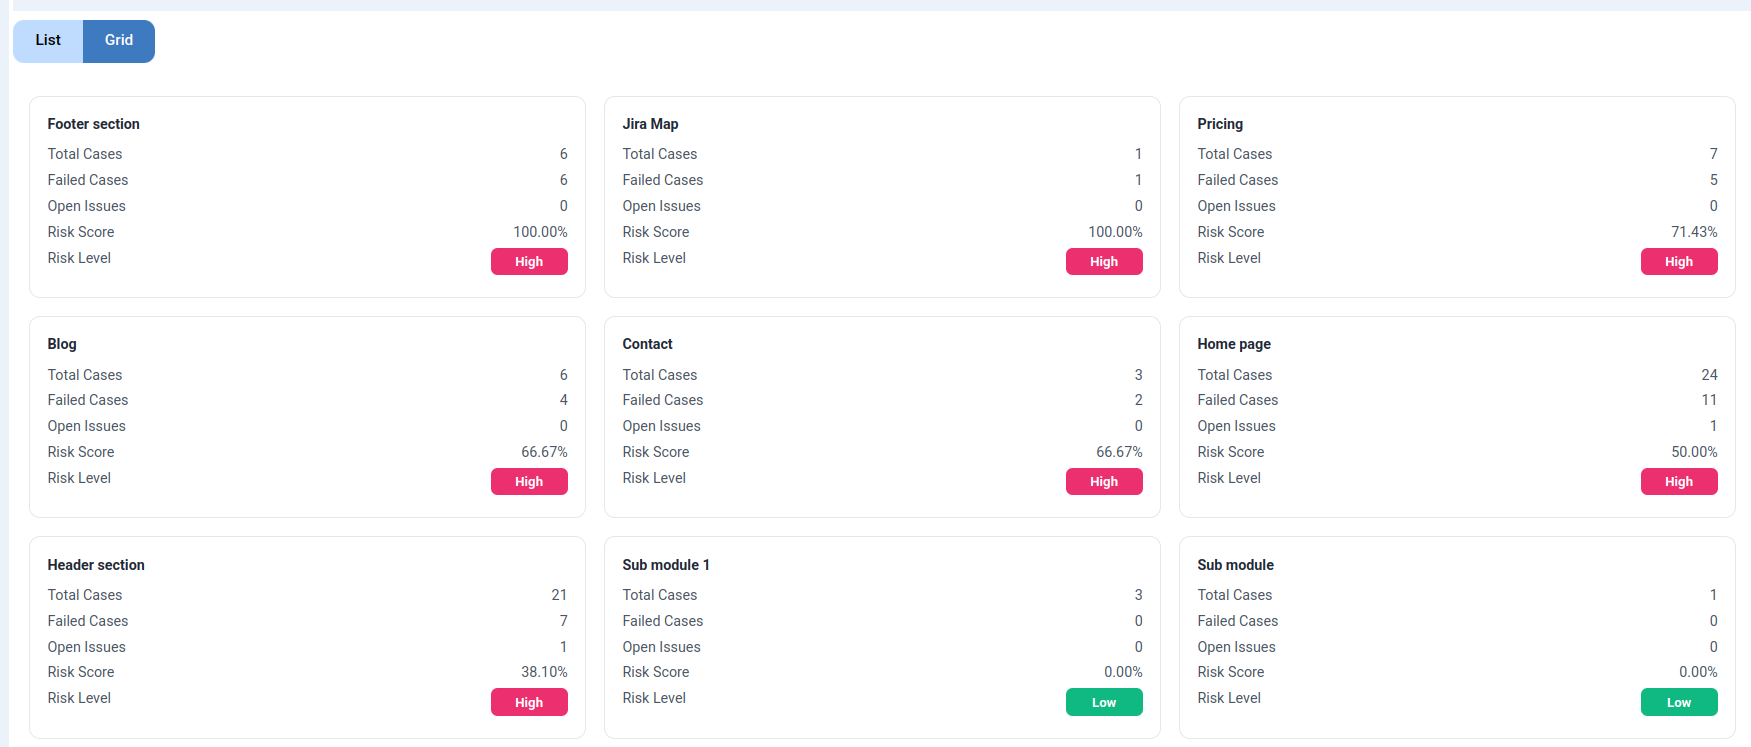
Once generated, the report opens under Reports > Module Heatmap (Module Heatmap Summary) and can be viewed in two formats:
- List – A tabular view of all modules with detailed metrics.
- Grid – A card/heatmap-style visual layout for a quicker risk overview.
Reading the List View
Each row represents a module in your project, along with the following columns:
| Column | Description |
|---|---|
| Module | Name of the module or section being tracked (e.g., Footer section, Pricing, Blog). |
| Total Cases | Total number of test cases executed for that module. |
| Failed Cases | Number of test cases that failed within that module. |
| Open Issues | Number of unresolved issues linked to the module. |
| Risk Score | Percentage calculated based on failed cases against total cases — the higher the score, the higher the risk. |
| Risk Level | A quick-glance tag — High or Low — based on the Risk Score. |
Example: The Footer section module shows 6 total cases with 6 failures, giving it a 100% Risk Score and a High Risk Level — signaling it needs immediate testing attention.
How Risk Level Is Determined
- High Risk: Modules with a significant proportion of failed cases relative to total cases executed.
- Low Risk: Modules with little to no failures, indicating stable functionality.
This helps teams instantly spot which areas of the application are unstable and need re-testing or a closer look before release.
Why Use This Report
- Prioritize testing efforts by focusing on modules flagged as High Risk first.
- Track execution patterns across modules over time.
- Identify weak areas in the product before they impact end users.
- Support release readiness decisions with clear, data-backed risk indicators.
Tip
Use the Grid view for a quick visual scan during stand-ups or release reviews, and switch to the List view when you need exact numbers for reporting or documentation.