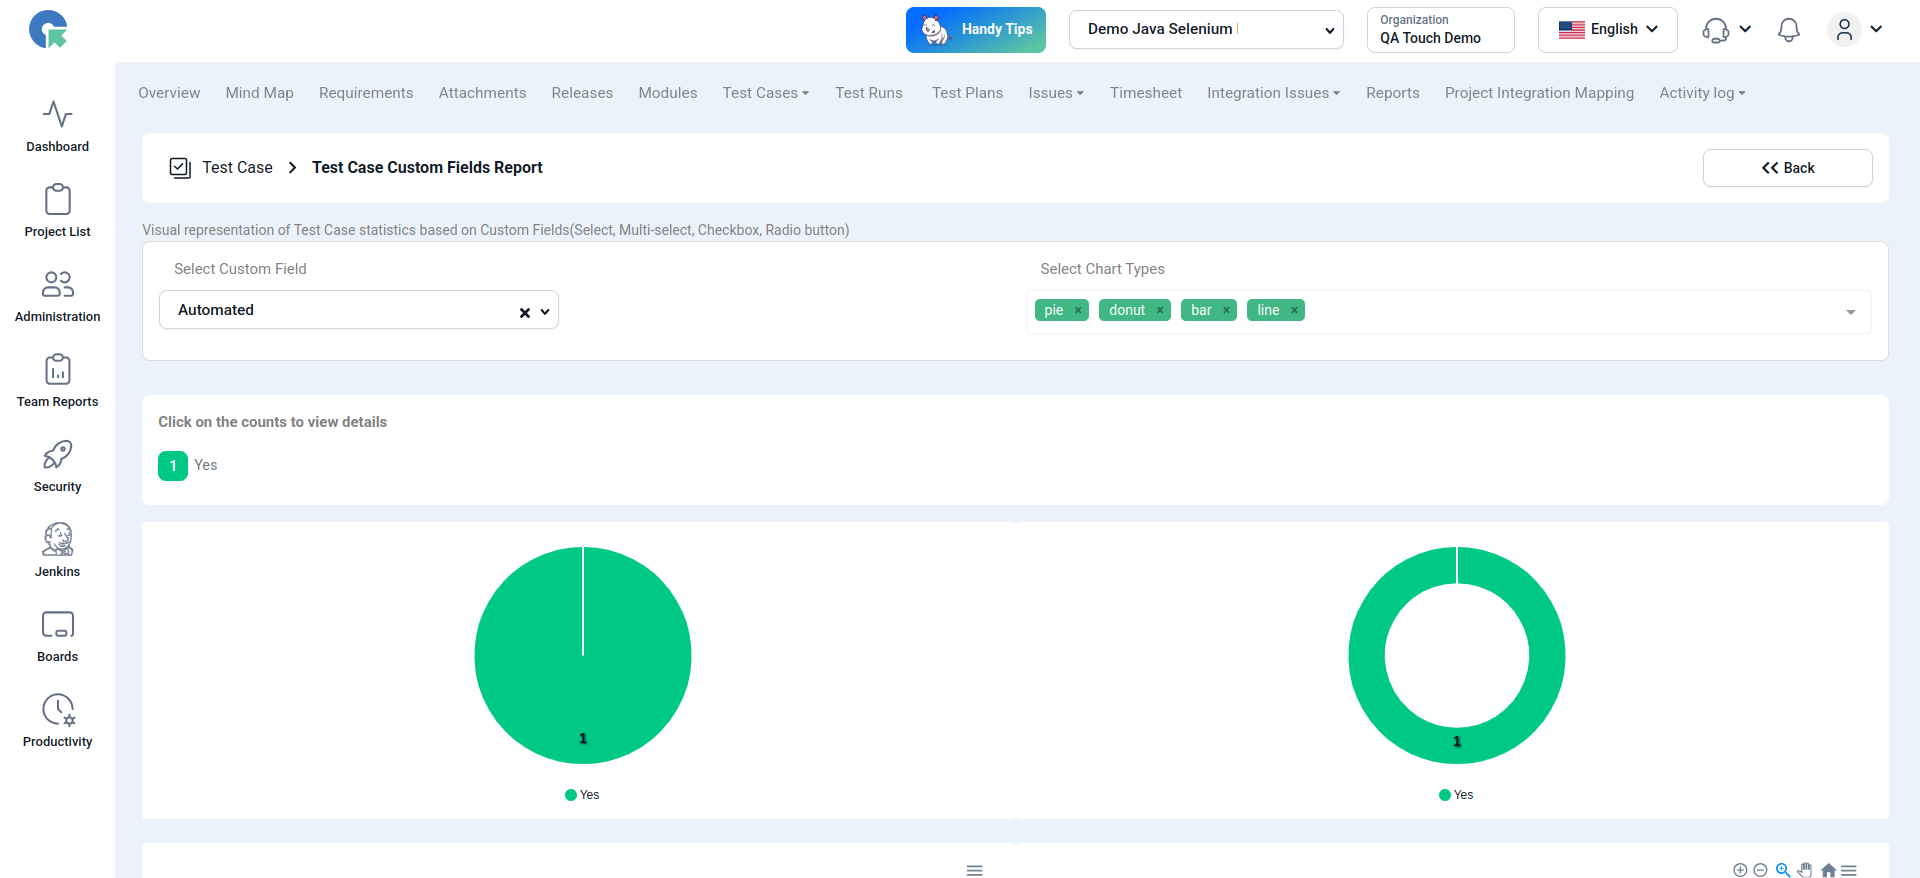
Test Cases - Custom Fields Reports
Test Case Custom Field Report (Graphical Reports)
Test Case Custom Field Report provides stats of Test cases based on custom fields you’ve added to your test case - such as language, browser, version, or any other user-defined attributes.
-
To use this report, make sure custom fields are configured in your project and values are added to your test case
-
If your test cases don’t yet have custom field values, use the Bulk Update or Import feature to assign them.
-
Reports will only include custom fields that are actively used
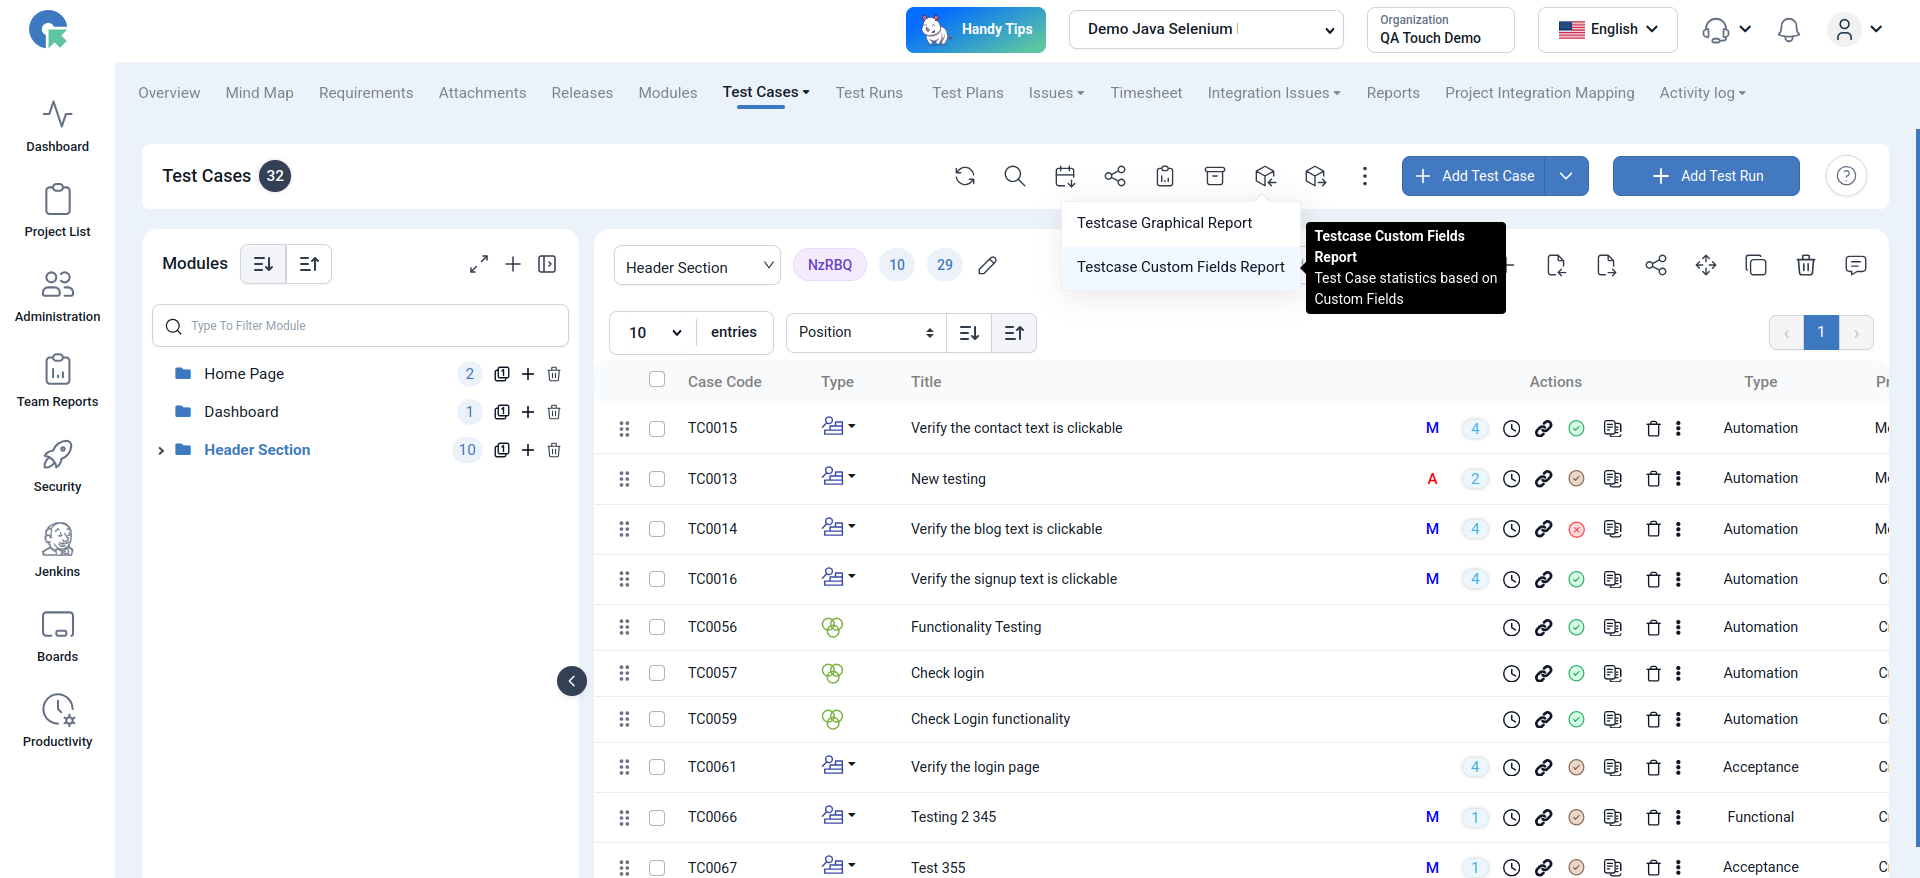
How to generate a custom field report?
- Log in to QA Touch
- Navigate to Test case page
- Click on Graphical Reports icons -> Test case custom fields report
- Select the custom field in the dropdown
- Graphical report will be generated according to the selected custom field
Supported charts in custom field report:
- Pie chart
- Bar chart
- Donut chart
- Line line