GitLab Pipelines
Connect your GitLab account to QA Touch, map a GitLab project to a QA Touch project, and view detailed pipeline run information without leaving QA Touch.
GitLab Pipeline Authentication
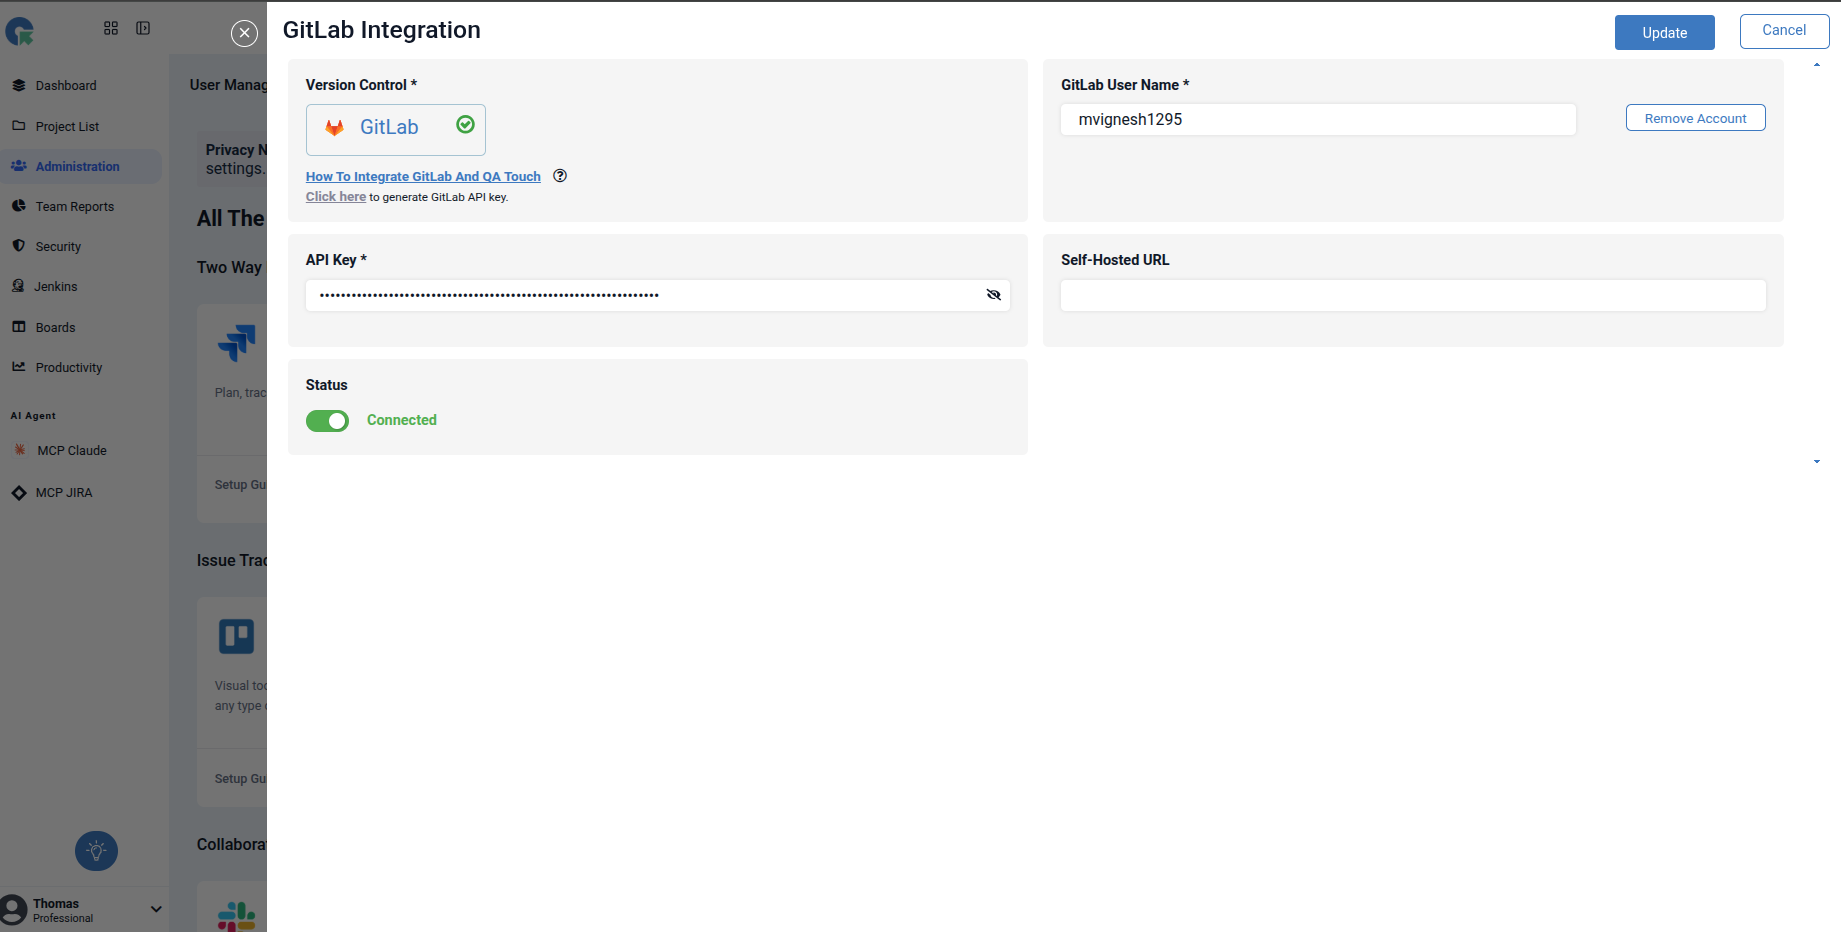
- Go to Administrator → Integration Settings.
- Click GitLab.
- A GitLab integration overlay will open.
- Enter your GitLab Username and GitLab API Key.
- Click Connect to authenticate your GitLab account.
- Once connected successfully, you can configure the GitLab pipelines.
Map a GitLab Project to a QA Touch Project
You can map a GitLab project to a QA Touch project using Project Integration Mapping. This allows QA Touch to associate the selected GitLab project with your QA Touch project.
Map a GitLab Project
- Go to Project List.
- Select the required QA Touch project.
- Click Project Integration Mapping.
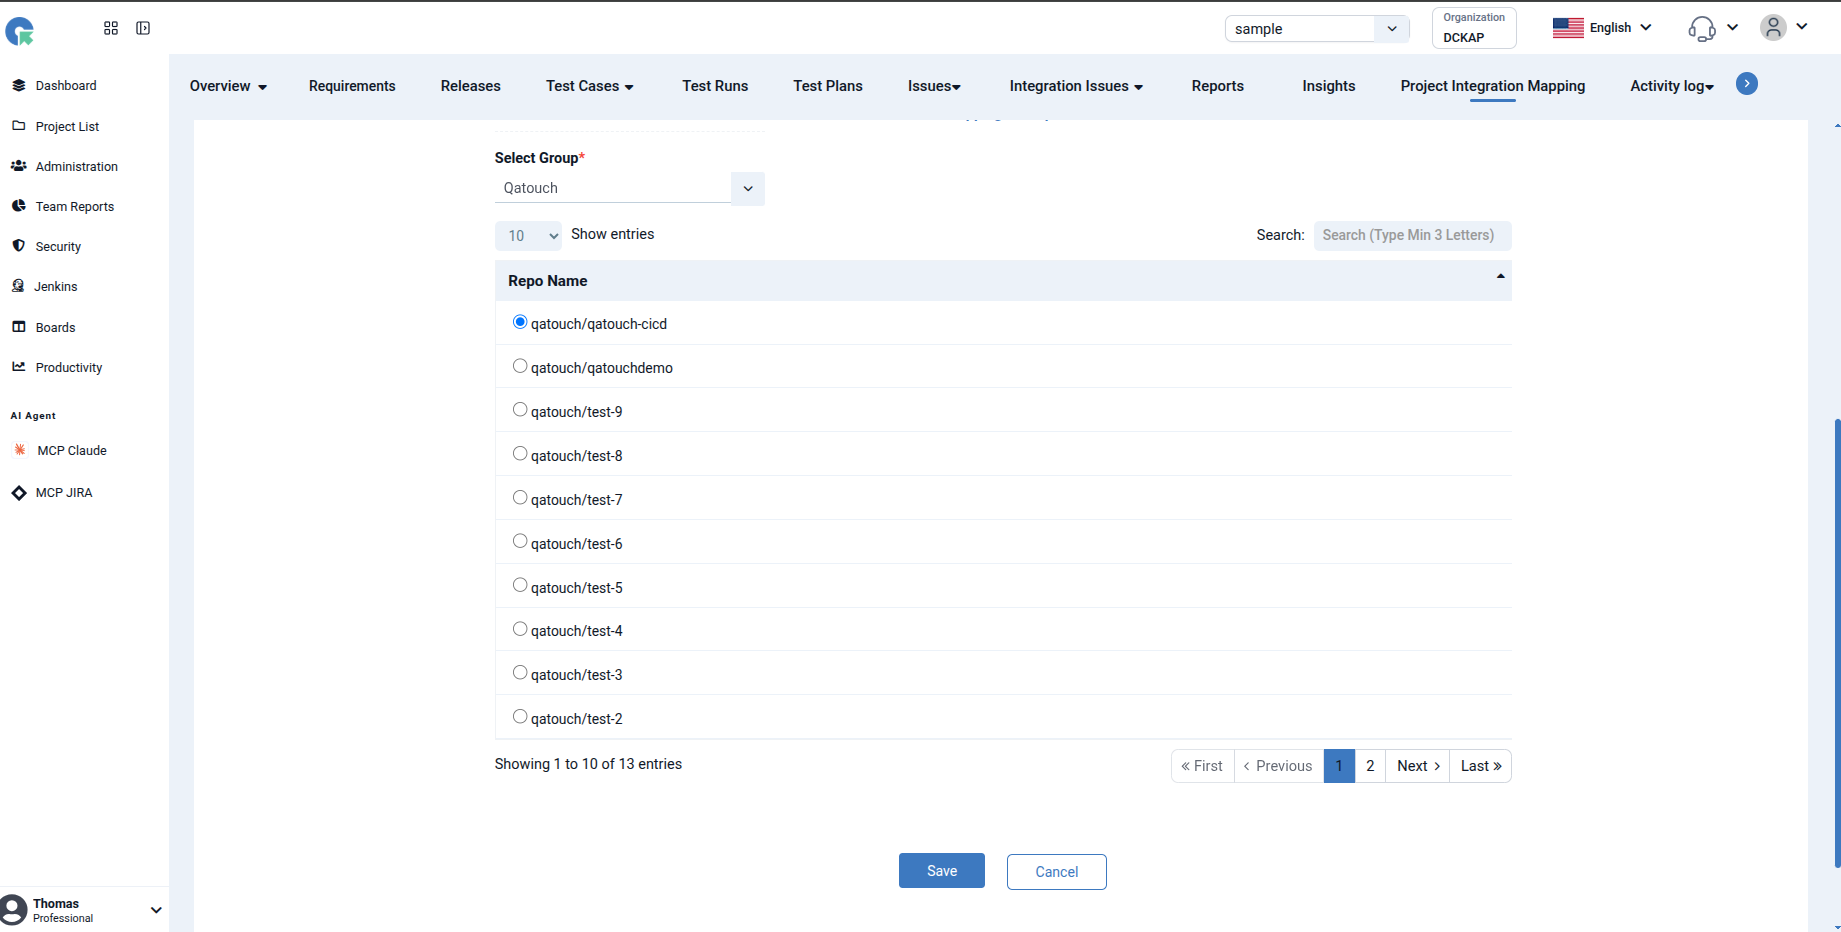
- Navigate to the Secret Group section.
- Select the GitLab project you want to map.
- Click Save.
Once the mapping is saved, the selected GitLab project will be associated with the QA Touch project.
GitLab Pipeline Listing
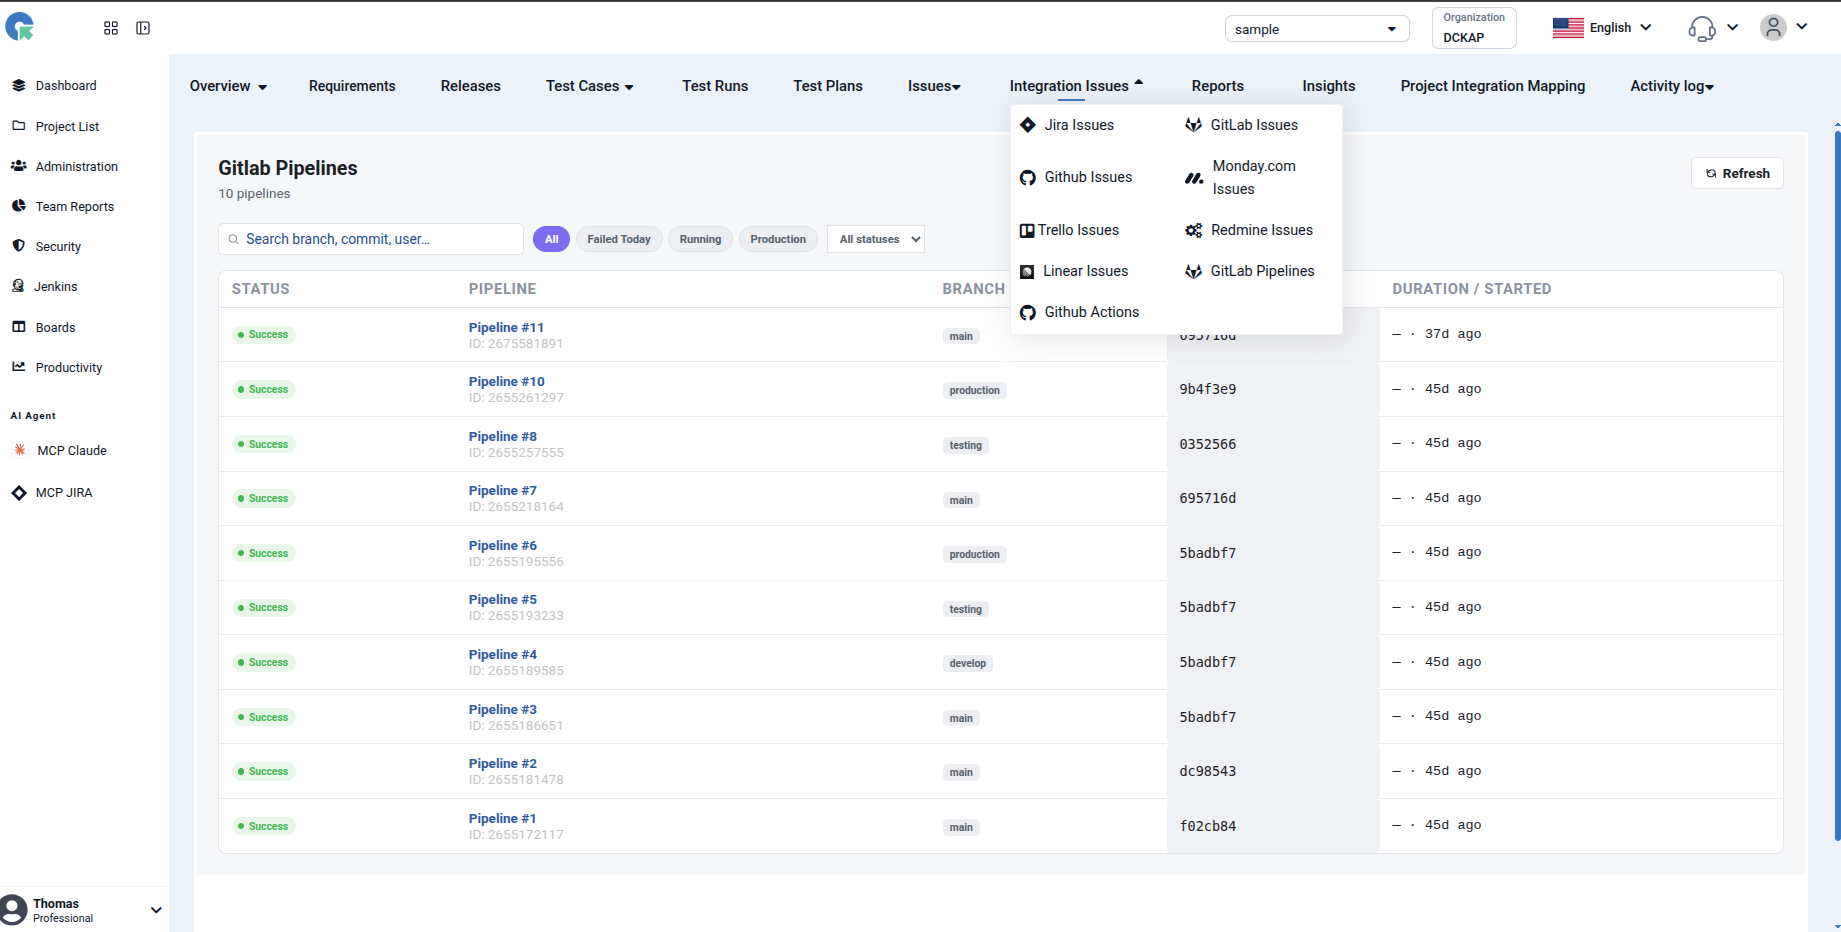
Go to the GitLab integration page → click GitLab Pipelines → you should be able to see the list of GitLab pipelines.
How to View Pipeline Details
This guide explains how to open a pipeline and review its stages, jobs, and run information.
Steps
- Go to the Pipelines list.
- Click on the pipeline you want to inspect. Click anywhere on the pipeline row (or its ID, e.g.
Pipeline #11) to open the pipeline detail view. - Review the pipeline summary. At the top of the detail panel you’ll see key run information:
- Status — e.g.
Success,Failed,Running - Commit Message — the message tied to the triggering commit
- Branch — the branch the pipeline ran on (e.g.
main) - Commit SHA — short hash of the commit (e.g.
695716dc) - Triggered By — the user or process that started the pipeline
- Created / Finished — timestamps for when the run started and ended
- Duration — total run time
- Environment — the target environment, if applicable
- Status — e.g.
- Explore the tabs:
- Pipeline — visual breakdown of all stages and jobs
- Variables — CI/CD variables used in this run
- Jobs — flat list of every job executed, with logs
- Read the stage columns. Jobs are grouped into stages, shown left to right in execution order. For example:
- Deploy (1) →
deploy-prod - Test (2) →
test-job1,test-job2 - Build (1) →
build-job
- Deploy (1) →
- Read each job card. Every job card shows:
- A status icon (green check = passed, red X = failed, etc.)
- The job name
- The job’s run duration (e.g.
0m 27s)
- Drill into a specific job. Click the arrow (
›) next to a job name to expand it and see its logs, artifacts, and detailed output. - Filter jobs (optional). Use the Search jobs… box or the All statuses dropdown to quickly find a specific job or filter by status (e.g. only failed jobs).
- Close the detail view. Click the × in the top-right corner to return to the pipelines list.
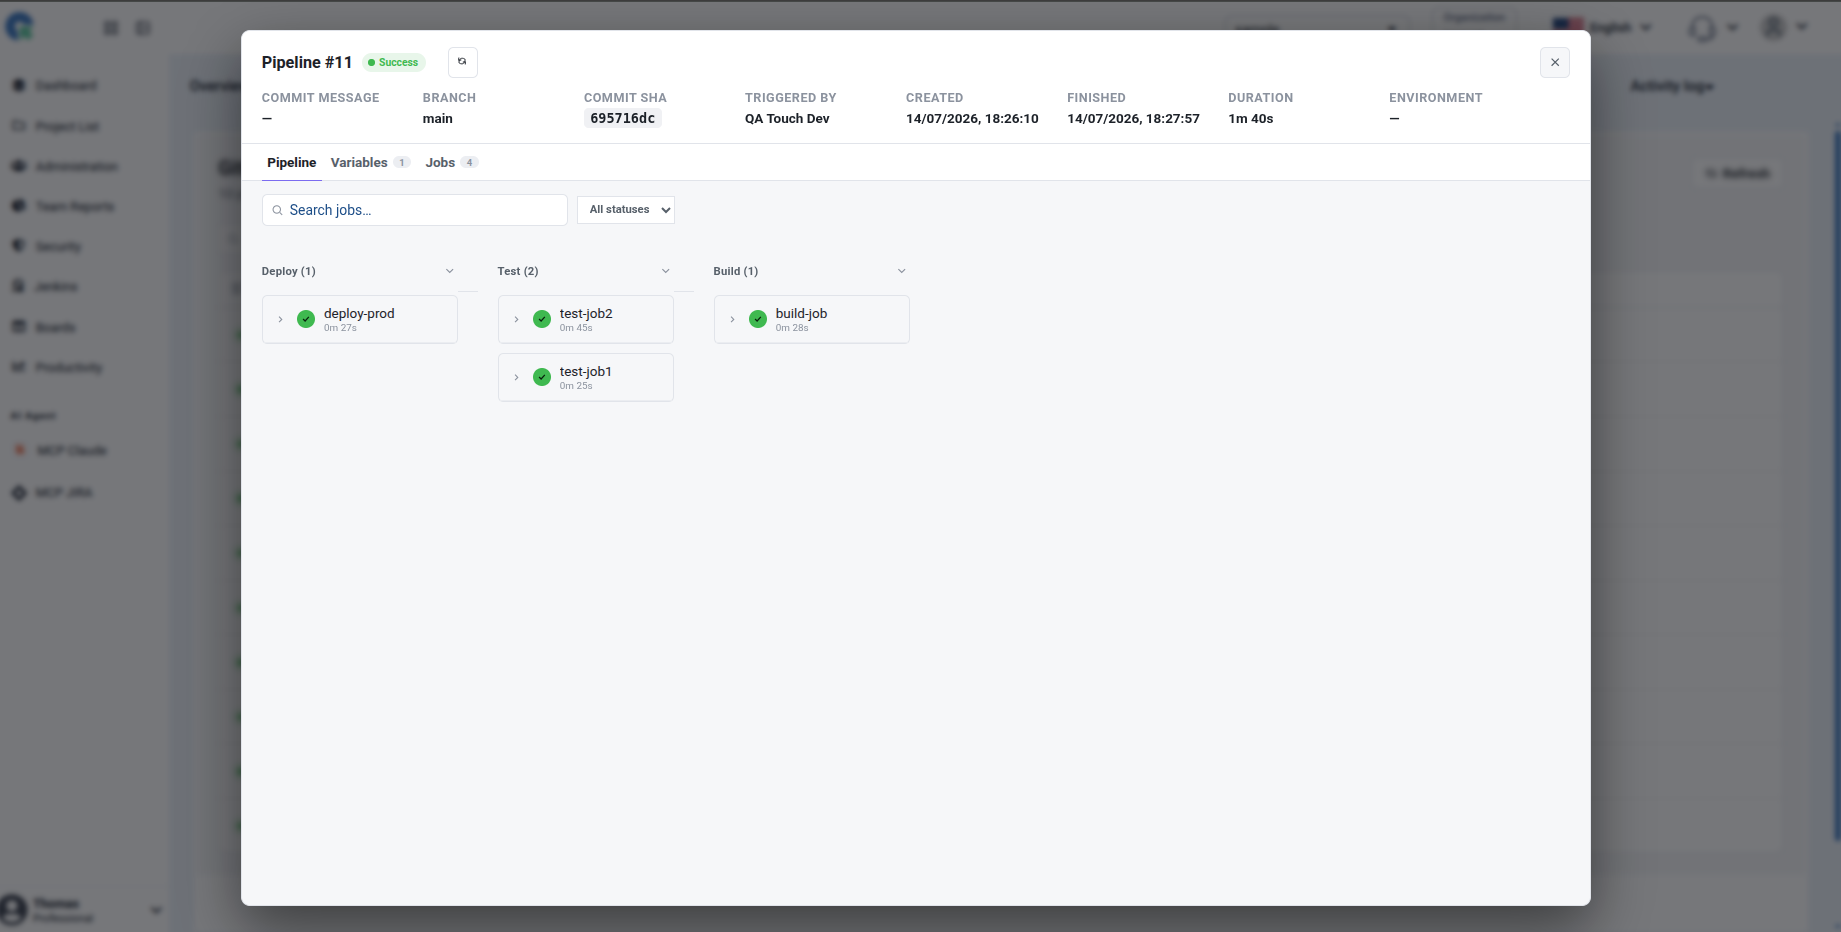
Tip: A quick glance at the stage columns and job icons tells you at once whether a pipeline fully succeeded, or which stage/job needs attention if something failed.