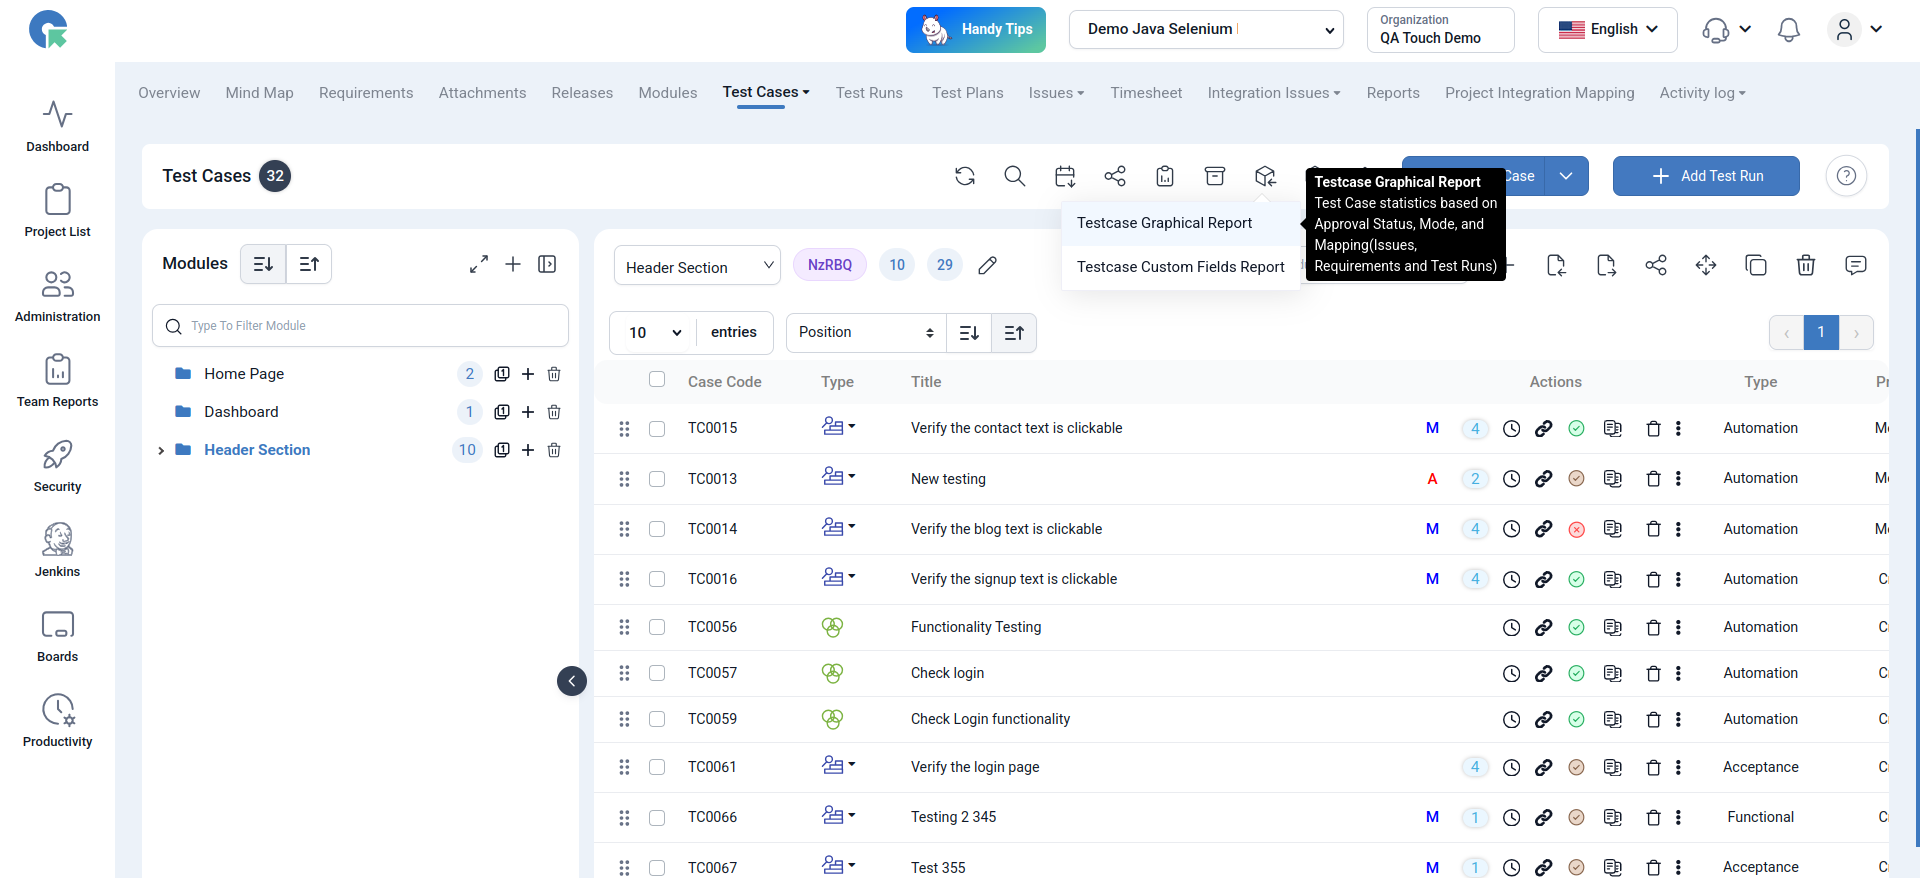
Test Cases Reports
Overview
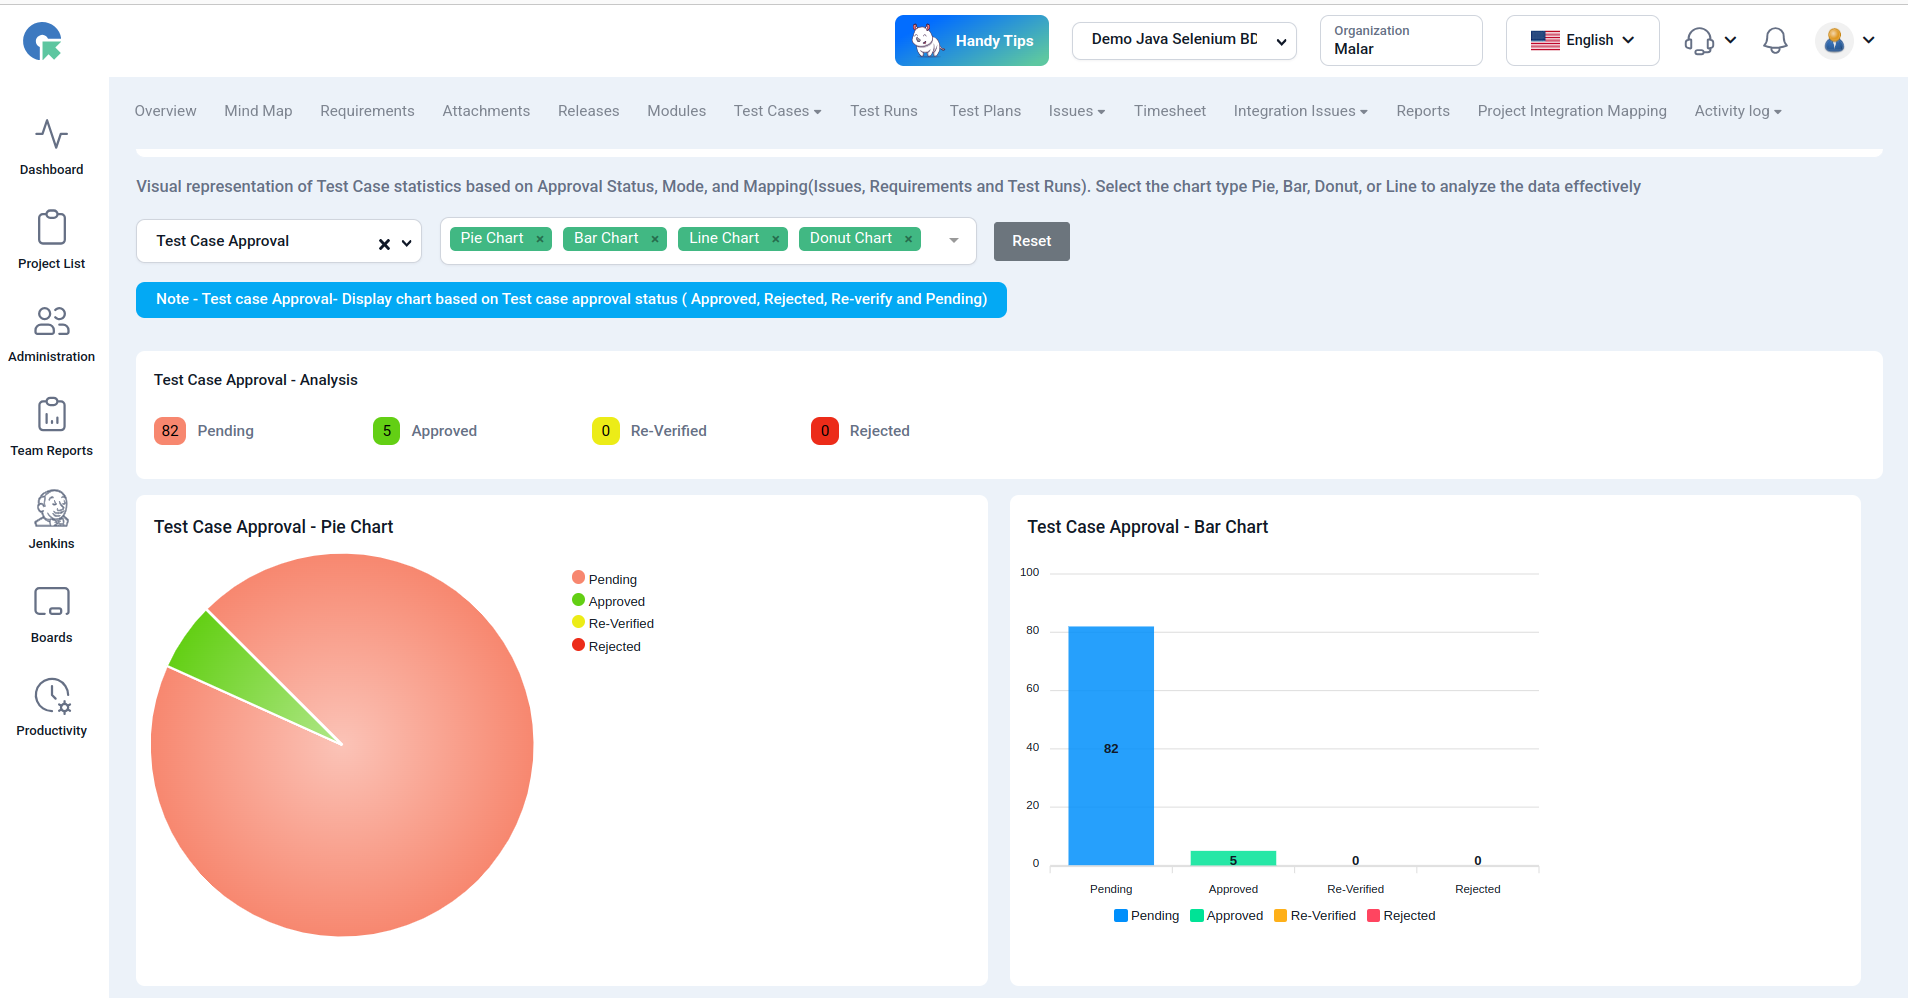
Visual representation of Test Case statistics based on Approval Status, Mode, and Mapping(Issues, Requirements and Test Runs). Select the chart type Pie, Bar, Donut, or Line to analyze the data effectively
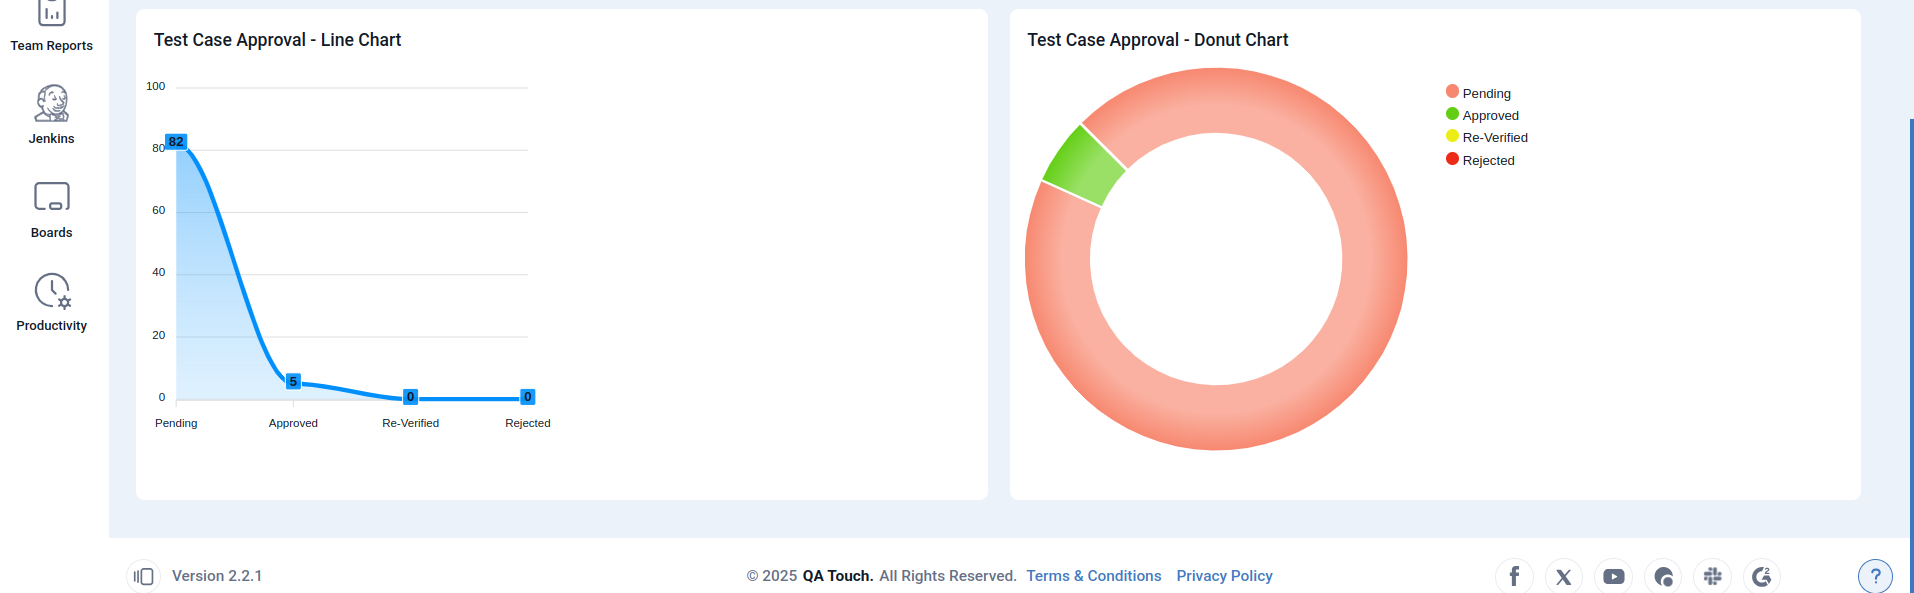
Test Cases Approval
Display chart based on Test case approval status ( Approved, Rejected, Re-verify and Pending)
Manual / Automation Mode
Displays a chart showing the distribution of test cases based on their execution type: Manual vs. Automated.
Test Cases with Issues
Mapped Issues - Display chart based on Test Cases With Or Without Issues
Test Cases with Test Runs
Mapped Test run - Display chart based on Test cases linked with test run and test cases not linked with test run
Test Cases with Requirements
Mapped Requirements - Display chart based on Test cases mapped with requirements and test cases not linked with requirements